EV charging analytics for the City of Charlotte.
The City of Charlotte runs 208 ChargePoint EV stations across 46 locations but had no way to see utilization, cost, or station health without an operator portal built for someone else. We built the analytics dashboard their staff actually needed.
City staff had to log into ChargePoint's operator portal — a tool built for station operators, not municipal decision-makers — to check utilization, electricity cost, and which stations were down. Data for the three org units (City, Airport, Water) lived in separate views with no consolidated picture.
A purpose-built analytics dashboard on Cloudflare's edge. A Worker pulls the ChargePoint API every 30 minutes into D1; the front end surfaces utilization, cost intelligence, and operational health — including the UNREACHABLE and FAULTED stations that need maintenance — with role-based views for operations, finance, and leadership.
All 208 stations across 46 locations in a single pane, refreshed every 30 minutes. Sub-100ms response times from the edge. City staff get answers without touching an operator portal again.
TL;DR
The City of Charlotte operates 208 ChargePoint EV charging stations across 46 locations. To answer a basic question — which stations are underused, what is electricity costing us, what is broken right now — city staff had to log into ChargePoint’s operator portal. That portal is built for the people who install and service hardware, not for the people who plan budgets and set policy. We built the dashboard the city actually needed: a purpose-built analytics layer that pulls the ChargePoint API into Cloudflare’s edge, consolidates three separate organizational units into one view, and presents utilization, cost, and operational health in language a department head can act on.
The problem
The city’s charging network is not small and it is not simple. The 208 stations are split across three organizational units that, on paper, are different parts of the same government: City of Charlotte proper (178 stations), Charlotte Douglas International Airport (20 stations), and City of Charlotte–Water (10 stations). Each unit has its own budget, its own facilities staff, and its own reason to care about the data.
ChargePoint’s own portal is a capable tool — for station operators. It surfaces session logs, connector status, and firmware state. What it does not do is answer the questions a municipal decision-maker brings to the table:
- Which of our 46 locations are carrying real load, and which ones did we install and forget?
- What is the month-over-month electricity cost, broken out by org unit, so each budget owner sees only their own numbers?
- How many stations are unreachable or faulted right now, and how long have they been down?
- Is usage trending up fast enough to justify the next round of capital spend?
To get even partial answers, staff were exporting CSVs and rebuilding the same picture by hand, every reporting cycle. The data existed. The decision-grade view of it did not.
The technical approach
The build is deliberately lean. A municipal internal tool does not need a sprawling backend — it needs to be correct, cheap to run, and fast enough that staff actually open it.
Edge-native, serverless. The whole system runs on Cloudflare. A Worker on a 30-minute cron pulls the ChargePoint API (v5.0, authenticated access already established with the city) and writes normalized station, session, and status records into Cloudflare D1. The React front end — built with Vite and Tailwind — reads from a thin Worker API in front of D1. There is no always-on server to pay for or patch. Response times sit under 100ms because the data and the logic both live at the edge, close to the user.
One model across three org units. The ingestion layer tags every station with its org unit and location on the way in. That single decision is what makes the rest of the dashboard possible: every chart, every cost rollup, and every health count can be sliced by City, Airport, or Water without re-querying ChargePoint. A leadership user sees all 208 stations; a Water department user sees their 10 and nothing else.
Role-based access. The dashboard ships four roles — Admin, Operations, Finance, and Leadership. Operations gets station status and maintenance queues. Finance gets cost breakdowns and trend lines. Leadership gets the high-altitude utilization and capacity view. The roles are not cosmetic; they decide which queries run and which data a session is allowed to see.
Operational health, surfaced not buried. At the time of the build the network had 29 stations reporting UNREACHABLE and 2 reporting FAULTED. In ChargePoint’s portal those are individual status flags you find one station at a time. In the dashboard they are a count on the landing view with a drill-down — so a facilities lead sees the maintenance backlog the moment they log in.
What we shipped
- A single-pane dashboard covering all 208 stations across 46 locations and 3 organizational units.
- A 30-minute automated sync from the ChargePoint API into Cloudflare D1 — no manual CSV exports.
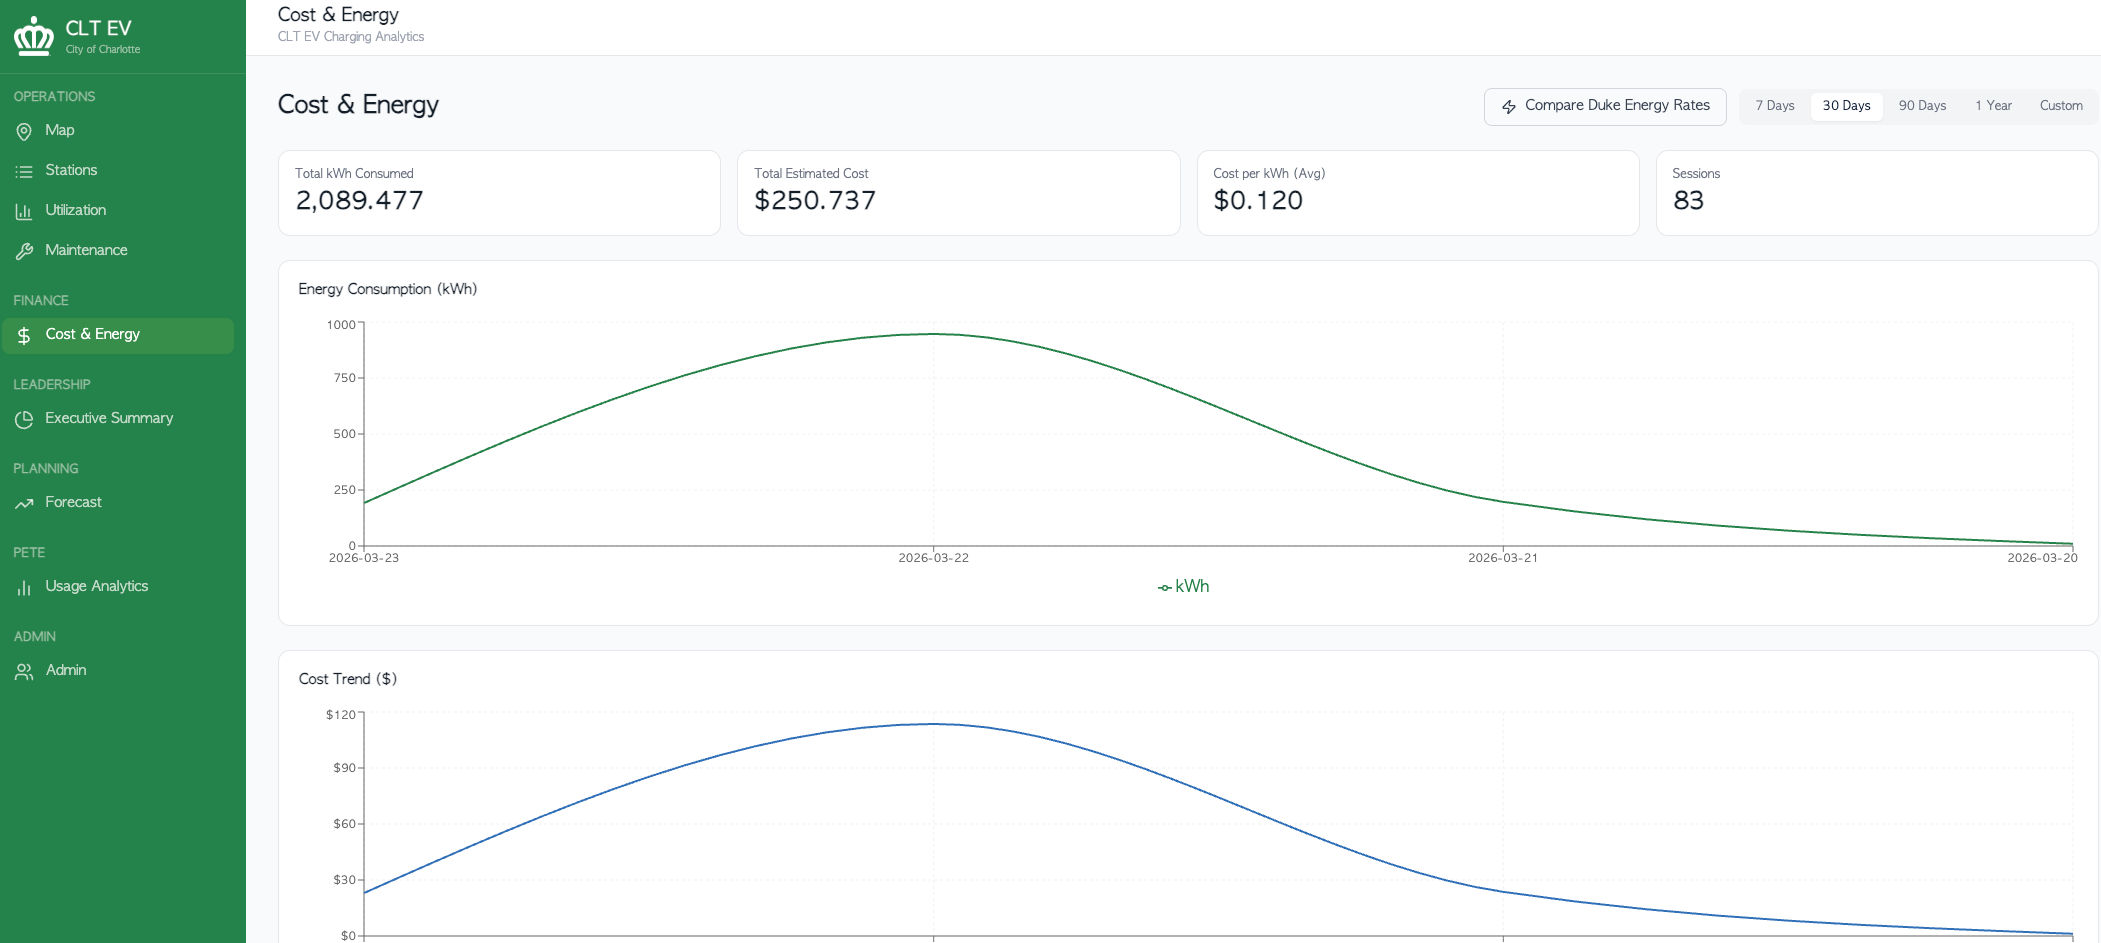
- Cost intelligence: electricity spend tracked per station, per location, and per org unit, with month-over-month trend.
- Utilization analytics that flag underused stations and surface peak-hour demand for capacity planning.
- An operational health view that pulls UNREACHABLE and FAULTED stations to the front for maintenance triage.
- Four role-based views — Admin, Operations, Finance, Leadership — each scoped to the data that role needs.
- A read-only architecture by design: the dashboard reports on the network, it does not control hardware, and it stores no driver payment or personal data.
The result
The city now has the view it was missing. Staff open one dashboard instead of logging into an operator portal and rebuilding reports by hand. Each budget owner sees their own org unit’s cost and usage without wading through the other two. The maintenance backlog — the unreachable and faulted stations — is visible on arrival instead of discovered station by station.
Because the whole system is serverless and edge-native, it costs almost nothing to keep running, and there is no server for city IT to maintain. The dashboard is read-only and stores no personal or payment information, which kept the data-governance conversation short.
It is also a foundation. The v1 scope was deliberately a dashboard, not an alerting platform — but the 30-minute sync and the D1 history it builds up are exactly what a future maintenance-alerting layer would need. The hard part, a clean and queryable model of the city’s entire charging network, is done.